Anyone who has worked in financial markets managing money through real crises must have asked the same questions I once had:
"Is there a way of distinguishing whether a market downswing is just another harmless fluctuation or the beginning of something far more serious like a crash?"
"Is market timing possible? How can I detect a major crash early to sell my risk positions ahead of others — and know when it became safe to jump back in?"
"What do I do with my portfolios when correlation assumptions break down?"
Answers, however, are much harder to come by. It took me decades to figure this out.
Maybe it was luck, but my peculiar experiences in life helped position me uniquely to do so. I lived through the Brazilian hyperinflation years of the 1980s, the emerging-market panics of the 1990s from a trading floor in São Paulo, and through the 2008 collapse from a trading floor in New York. In all, I endured more than twenty crises, large and small, across a long career that took me through Citigroup, Morgan Stanley, BBVA, JP Morgan Chase, and other large global banks in New York, Hong Kong, and São Paulo, among other financial hubs.
No two crises were exactly alike. Every one of them taught me something new. But one problem never went away.
At the worst moment inside a crisis — when models break down, assumptions no longer hold, and experts contradict each other — the tools everyone depended on failed me exactly when I needed them most. VaR told me I'd breached my limits, but only after the damage was already done. Stop-losses were mechanical and blind, giving me an exit but no intelligence into the future. Stress tests were useless the moment the market itself became the stress. Hedges became prohibitively expensive at the precise moment I needed them most. And the macro, fundamental, and technical analysis I'd been trained on went quiet on the only question that mattered in those moments: what should I do? Buy, sell, hold, stop… and how confidently?
Here's the hard truth, and we all know it: there is really no appropriate tool made for a crisis situation — let alone one that objectively alerts us to take defensive action early enough.
In every crisis, one thing never changes: blood in the streets. Destruction of wealth. Your clients' money. Your own money too. This is not supposed to be like this. How is it possible that we, the financial experts, are so powerless to prevent such disasters? And what do we keep telling our clients — diversify, diversify, diversify? But can't we do any better than that? The very act of diversifying reveals an undeniable fact: that we don't have a clue about what comes next (besides opinions or guesses), so much so that we must hold a little bit of a variety of different assets at all times, just in case. It's like having no weather forecast and being forced to prepare for every possibility — sunny, rain, wind, snow — every time we venture outside. Doesn't that bother you when you really think about it? The industry simply became so used to it, treating it as the way things are. No one can accurately predict future prices, and market timing is simply impossible.
Dollar-cost averaging and portfolio rebalancing (time-based or price-based) are valid attempts at solving the problem, but these are only halfway solutions at best. There is no escape: just like diversification, with these tools you must always forgo some return to reduce some risk. Inevitable, so they say — the price to pay for safety. Call it the cost of hedging, or whatever you like.
Come 2008, after years of frustration, the damage from the Great Financial Crisis became particularly personal to me. Friends and family suffered greatly. Their personal stories broke my heart. Same with colleagues in the industry — very ugly, very painful.
2008 became the turning point, at least for me.
That year I was studying mathematical finance at NYU's Courant Institute at night while the crisis unfolded on my screens — and trading accounts — by day. Then something incredible and totally unexpected happened: a random class discussion on the very subject, followed by a group brainstorming later, provided the inspiration and triggered the first spark toward working seriously for a solution. My years of frustration and learning at the trading desk mixed with new quantitative research and ideas from others, leading me in directions I couldn't have planned for. In my mind, we needed to develop an early crash detector. But in the end, it turned out to be a tool that gave me more than I had bargained for. It helped me beat the S&P 500 with lower drawdowns — not once, but consistently, across both bull and bear markets — a tactical investing system that beats diversification, dollar-cost averaging, and portfolio rebalancing.
Having the will alone is far from enough, but it's a start. I didn't know it at the time, but just getting to a minimally workable prototype took me an insane amount of time — over a decade of trying, rethinking, giving it up, and restarting from scratch so many times I lost count. I learned from research papers, colleagues in the industry, and the work of others to refine my own. It took two more sparks to finally build the instrument I wish I had.
We live in a probabilistic world
I was fascinated with probability and statistics from an early age. My dad had always challenged me and my brother to think through problems in mathematics, especially geometry and probabilities. I learned to see how most things in life happen as a result of probability rules working in the background. I believed that even if we could not predict events that depended on multiple variables interacting in unknown or complex ways, we aren't entirely hopeless. We humans prefer to feel in control of everything, as if the world were deterministic even when it isn't. And I learned that when you're stuck on a difficult problem, often you need to reframe it, or take a fresh view from a completely different perspective.
What fascinated me about probability was that even for random and uncertain events, we are still able to take measurements, make sense of apparent chaos, and somewhat control outcomes in the aggregate. In business, a few industries can only exist because of it. One is the insurance industry. Another is the casino business. A life insurer won't know at what age a specific 45-year-old man will die, but it knows from the data the exact life expectancy of all 45-year-old men as a group. A casino can't tell whether it will win or lose any single play, but it does know it will certainly be profitable after a large enough number of plays — because it rigged the game slightly in its favor with a small statistical edge.
I always wondered why financial professionals almost never spoke the language of probability and statistics — with clients or among themselves. Financial markets are unpredictable by nature. Those who claim they can predict the market are either lying or just naïve. The market does live in a probabilistic world. So why do we work with deterministic tools in finance?
The good news is that we already know how to use probabilistic tools to deal with uncertain processes and unpredictable events. Casinos do it skillfully. We can do it in finance too.
For example, we price stock options with the Black-Scholes formula. While recognizing that stock prices are unpredictable, Black-Scholes can still price options on those prices. How is it possible to price something that depends on an unpredictable variable? The answer: probabilities.
Timing prices vs. timing risks
Mainstream finance postulates that market timing is impossible. It's probably correct, because asset prices are unpredictable. They may or may not be perfectly random, but either way, the underlying variables and their inter-relationships are simply too complex to model accurately. Practically speaking, future prices are inherently unpredictable.
As a result, market rallies and crashes must therefore be equally unpredictable — that was the widely accepted conclusion. It would be futile to create an early indicator to help us accurately time the market, avoiding crashes and buying into rallies in time. Hopeless, right?
Well, not too fast. Let's reframe the problem from a different angle, and ask different questions:
What if, instead of figuring out when to buy and sell an asset, we figured out when to take risks and when not to?
According to the risk-aversion principle, asset prices tend to decline when market risks rise, and vice versa. This is more than correlation — it is a causal relationship, which is far more powerful.
With this bridge connecting stock prices to market risks, the only remaining challenge was to figure out how to accurately measure and differentiate market risks.
In modern finance, market risk almost always means Value at Risk (VaR). But VaR is a tool to limit risk "after the fact" — after realized or projected volatility had already breached a pre-approved limit — often triggering when losses have already hit the books.
For what I wanted, I needed a different definition of market risk — the collective, market-wide perception of risk, measured from the market itself (not just prices) in real time. When I started this project, I had no clue what it was, let alone how to measure it.
But I did have a north. I wanted to build a tool to help me avert market crashes. An early warning system. A tool that told me when to take risks and when to avoid them entirely. The original goal was simple and narrow. I didn't know it back then, but it turned out to be something far more powerful: it not only kept maximum drawdowns low (I could actually control it by adjusting a single parameter — the RPT, discussed below), it also boosted a variable that might be considered the holy grail of investing — the return-to-risk (or return-to-drawdown) ratio. As a risk-timing tool inside a tactical investing system, this solution was able to solve, or at least mitigate, the variable-correlation problem. The RISP 500 risk indicator was finally born.
A missing piece, hiding in plain sight
I didn't know it yet, but the tool I needed to build had a raw material I hadn't had access to before: the emerging VIX futures market. For the first time, the market's own forward-looking assessment of risk — not a backward-looking statistic, not a historical simulation, but the live, priced expectation of every serious participant with capital on the line — became observable in real time.
For me, the VIX ecosystem was the missing link, and the second spark. The more I learned about it, the more convinced I became that I was onto something. But knowing the idea and building a working instrument are very different things, and the calibration took years — piece by piece, refined against every crisis I lived through later on as a practitioner.
A large number of candidate variables were tested. Most were found to have little significance to the risk model. The remaining ones — about 15 to 17 variables, the majority from the VIX ecosystem — were the most relevant for a short-term gauge of the market's collective risk perception. Variables and their weightings may change over time with updated calibrations. Some may be dropped; new ones may be added. It has to be a live organism that adapts to and evolves with the market. Changes must be made responsibly, with care and continuous testing. The VIX world provided multiple variables to the model: VIX futures, VIX cash term structure, Volatility Risk Premium (VRP), Volatility of Volatility (VVIX), contango/backwardation, roll yield, among others.
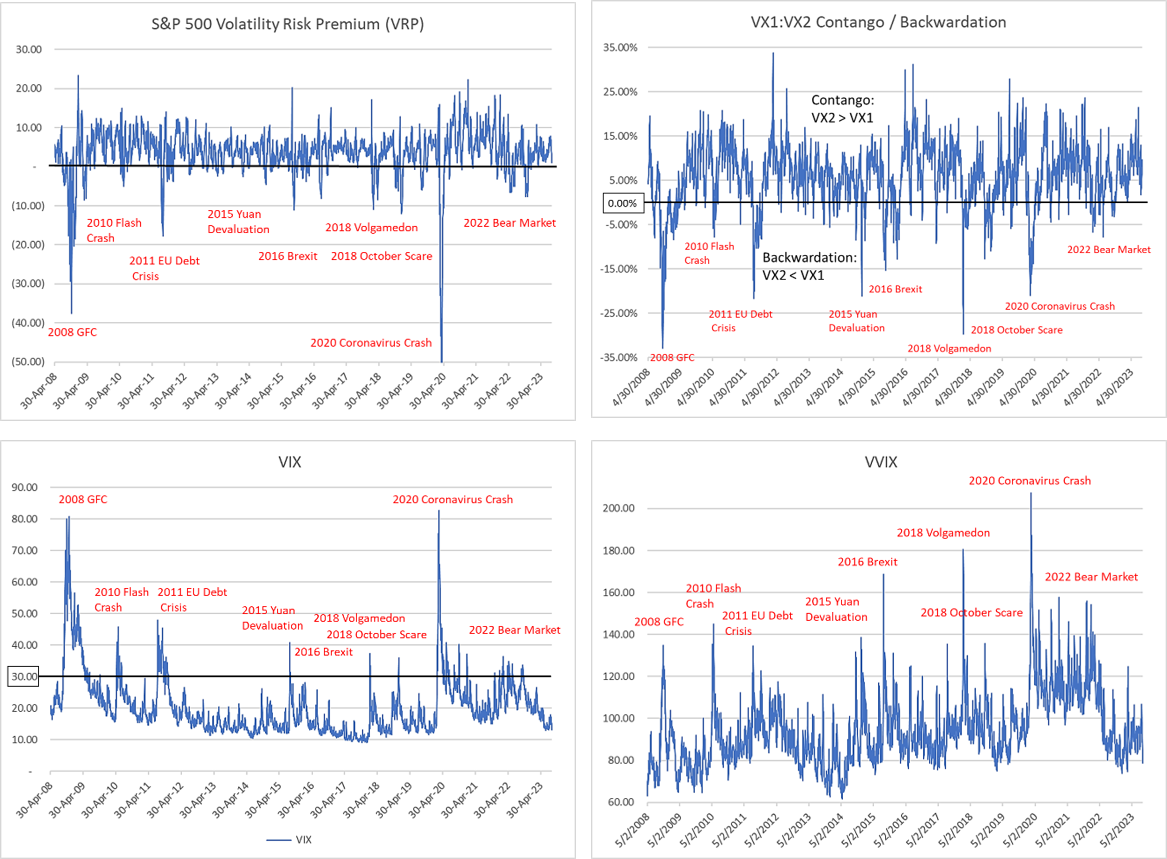
As you can see from the charts, these variables spike during crashes and stressful times. Taken alone, none has much predictive power. But taken together, a much clearer picture of the collective "mind" of the market emerges. The challenge was to map this out in an accurate risk-gauging model. The RISP 500 is the culmination of that effort.
I continuously test strategies with several asset combinations. I've tested two-level risk systems and three-level risk systems — the latter has proven to deliver much stronger results. For example, I've tested tactical strategies rotating a variety of assets: volatility ETFs (SVXY and VIXM — short and long volatility), Mag-7 ETFs (MAGS and leveraged MAGX), gold ETFs (GLD and leveraged UGL), a Bitcoin ETF (IBIT), among many others. But history has told me that the best are my two flagship strategies: one based on the S&P 500 (SPY, and its leveraged version SSO) and the other on the Nasdaq 100 (QQQ, and its leveraged version QLD). In most of my experiments, I chose the gold ETF (GLD) as the safety asset, held in rotation when risks are highest or during crashes.
However, when gold lost its safe-haven property in 2026, especially after the Iran War, I replaced it with cash. Bond ETFs (e.g., IEF) and short-term treasury bills (e.g., SGOV) were considered but discarded given the current moment. The safety asset's job is to provide capital preservation during times of stress.
We must be smart and nimble when selecting the right safety asset. We can't be rigid and turn a blind eye to what the market is doing.
The RISP 500 Risk Indicator
Although the formulation is complex and took me almost two decades to build, the indicator is surprisingly easy to use. Well — not surprisingly. It was designed in its simplest form to let anyone follow a pair of easy instructions and execute in under five minutes a day.
The indicator was also designed so as never to be in the position of giving financial advice. It doesn't tell you what to do. It is like the weatherman telling you the probability of rain on a given day. What you do with the information is entirely up to you. Someone more averse to getting wet might take an umbrella at just a 20% chance of rain. Others might only take one out at 70% or 90%. Some might decide not to go out at all. Others might call a taxi, or wait the rain out. For the stock market, the RISP 500 is the weatherman. The indicator is a percentile rank from 0% (the lowest risk ever measured since 2008) to 100% (the highest). A conservative investor might rotate from risk assets to safe assets at 60% or 65%. An aggressive investor might not rotate to safety until the indicator reaches 80% or even 90%. Just as people react differently to rain, investors take action at different risk levels. Those key turning-point levels are called RPTs — Risk Percentile Thresholds — and they are deeply personal, because people have different risk tolerances and appetites for return. The system is highly customizable for each investor or client.
The simplest form: Early Crash Detector
Because the RISP 500 is just a risk indicator, it can be used to protect any portfolio and any strategy a practitioner already runs. At the minimum, it can serve as an early warning system to safeguard your client's wealth against sudden crashes that seem to come from nowhere. That was my original objective. All you do is define your own RPT (or the client's) and rotate between a risk asset (e.g., a stock, a portfolio, a leveraged or risky position) and a safe asset (e.g., gold, bonds, bills, cash — whatever you consider safe). For example, say you hold a portfolio of 10 stocks and ETFs. Say your risk profile is moderate, and you start with a 75% RPT (you can always adjust a couple of notches up or down as you gain experience with the tool). That simple setup is all you need. Subscribe to receive the daily email with the RISP 500 reading, measured around 10:30 am ET (about an hour after the NYSE opens). If the RISP 500 is below 75%, you hold your portfolio of risk assets normally. If the RISP 500 rises above 75%, you sell into the safety asset you defined — or simply hedge it. You wait until the RISP 500 falls back below 75% to rotate back into risk.
In other words, the RISP 500 guides you by showing you when to take risks and when not to, based on your own risk profile. Here in the simplest form, it works simply as an early warning system against crashes, or against risks you don't tolerate.
The advanced form: Accelerate wealth buildup at low risks
But the RISP 500 can do much more than detect crashes. A smarter way to use it is to add an extra RPT, splitting the 0%–100% range into three segments — high, neutral, and low risk — instead of two. With three levels, we can exploit the lowest-risk environment by being aggressive precisely when risk is low. The logic: hold safer assets when risk is higher, riskier assets when risk is lower, matching each asset to its risk environment. This is what I called Context-Dependent Dynamic Asset Allocation in my books. Here's an illustration with the flagship S&P 500 and Nasdaq 100 strategies:
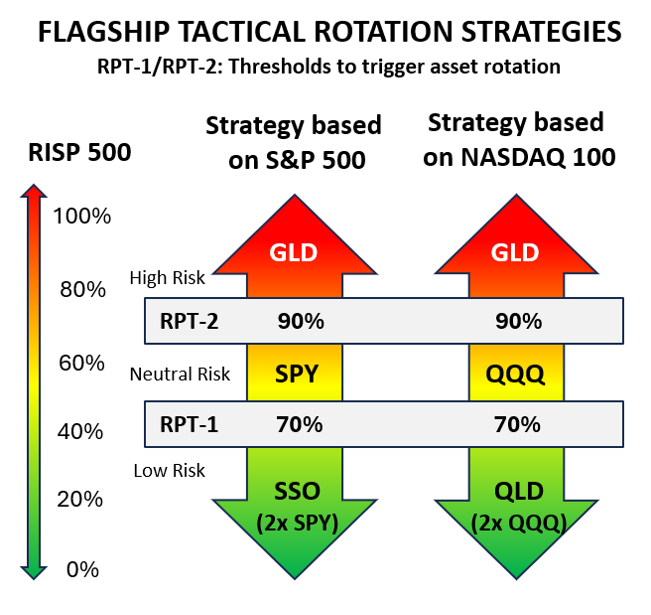
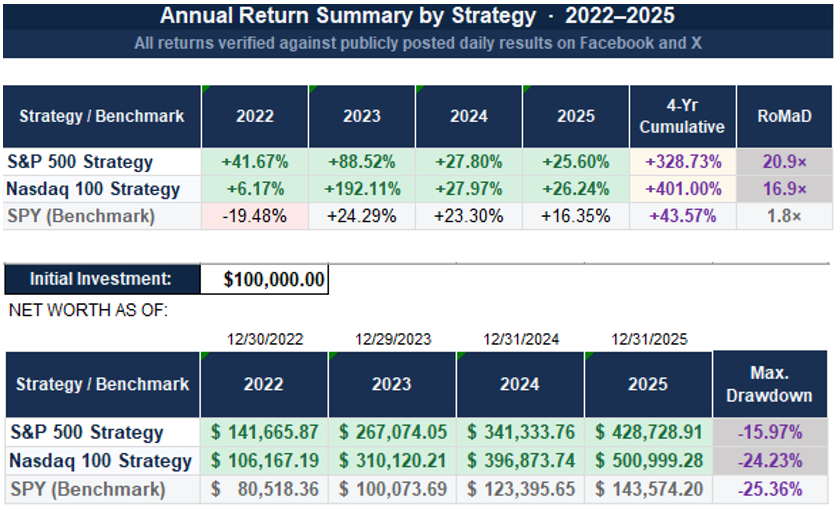
Over 2022–2025, the two-level S&P 500 strategy (SPY/Cash with RPT at 75%) returned 55.81% (CAGR ~11.6%) with a maximum drawdown of −8.72%. Its RoMaD (Return over Maximum Drawdown) was 6.4×. Compare that with the three-level S&P 500 strategy (SPY/SSO/GLD, RPTs at 70% and 90% — shown in the diagram), which returned 328.73% (CAGR ~42.8%) with a maximum drawdown of −15.97% over the same four years. Its RoMaD was 20.9×.
Now compare both strategies with the S&P 500 benchmark — simply buying and holding SPY: total return 43.57% (CAGR ~9.5%), maximum drawdown −25.36%, RoMaD just 1.8×.
Adding a third level to exploit low risk with a more aggressive asset delivered dramatically better results - exactly the type clients get impressed and expect - because a much greater return was delievered with a lower maximum drawdown during the investment period.
Here you see the real value the RISP 500 delivers. Unless you're a super-aggressive (or reckless) buy-and-hold investor holding SSO (2× leveraged SPY), most investors would never tap the power of SSO — it's just too risky, and most people who hold it blindly will almost certainly lose money. But with the RISP 500 gauging risk for you, you can invest in SSO confidently and selectively, only during known low-risk periods.
Now you know why "knowing when to take risks and when not to" is not just a punchline. Thanks to this concept, outperforming the S&P 500 with lower drawdowns became straightforward. Isn't this exactly what your clients want most — wealth preservation and high returns, at the same time?
The RISP 500 answers another great pain point in the industry. Pundits and big names seem to be forever sounding the alarm — a crash is coming, a bubble about to burst. The only problem is that the single most critical piece of information — when — is conspicuously missing. Without the timing, the prophets of doom cry wolf, and people learn to ignore them. After all, prices are unpredictable. But the RISP 500 supplies the missing when — not by forecasting it in advance, but by alerting you as events unfold, when the market is reaching a turning point. Ask yourself what's most valuable: knowing a crash might be coming, or knowing it's time to seek safety because a crash is imminent?
Again: we don't predict — we measure. What's more precise: a measurement, or a prediction?
In 2028, the RISP 500 will celebrate its 20th anniversary. Since its humble beginnings, it took more than ten years before I had a reasonable prototype that didn't fall apart under new scenarios the model wasn't trained on. The 2020 coronavirus crash was the first real (and live) proof I was on the right track: the framework held up, live, against a genuine global shock. That was the third spark in my decade-long journey. With high confidence now, I began to make the results public — writing a book, publishing papers, and posting the daily blotter on social media (X.com/RISP500 and Facebook.com/RISP500), where each post is time-stamped by the platforms, making it a live and public track record.
Whipsaw markets: we may have just created the antidote
I'd love to claim that the RISP 500 is so perfect it will help investors outperform the S&P 500 in any and all circumstances. But I can't, and shouldn't. It's true that almost every strategy we tested outperformed the S&P 500 every single year over the last four years (2022–2025) in live trading. But 2026 revealed the weakness that all tactical systems share: the infamous whipsaw market.
Characterized by a trendless, sideways market where uncertainty about direction is high, whipsaw markets can be kryptonite for tactical systems — bleeding them to death. A severe whipsaw triggers useless rotations at higher-than-normal frequency in a short period, forcing the system to sell low and buy high over and over. Small losses pile up with each unnecessary rotation, and the system quickly begins to underperform the benchmark.
Whipsaws appeared in the data (since 2008) used for testing, back-testing, and live trading (after 2022), but none were as severe as the 2026 whipsaw. Markets at all-time highs, fueled by enthusiasm about AI but also bubble concerns — plus the Tariff War, the Iran War, inflationary pressures, excess liquidity, de-dollarization trends, rising bond yields, and a hesitant Fed under political pressure — created the perfect conditions for a severe whipsaw. For the first time ever since 2008, this one made all strategies underperform the S&P 500. It forced us back to the drawing board in my risk lab.
Every kryptonite needs an antidote. Rather than modify the RISP 500 algorithm — which has already proven to do its job extremely well — we decided to build a separate algorithm, just to detect the whipsaw market early. Once a whipsaw is detected and confirmed from incoming data, we switch the RISP 500 off and hold the position (no trading) until conditions return to normal. But how do you identify a whipsaw early, when its distinctive features (trendless, sideways) only become clear once the price trajectory has already happened? That's exactly why indicators based on price alone can't warn us early. In our lab, we tested the main indicators commonly used to detect or confirm whipsaws: the Average Directional Index (ADX), the Choppiness Index, the Kaufman Efficiency Ratio, the Hurst Exponent, and Bollinger Band Width. Unfortunately, none worked well enough. I wrote and published a working paper, "A Systematic Evaluation of Mainstream Technical Indicators for Whipsaw Detection in Tactical Equity Strategies," on SSRN in August 2026, to discuss the findings.
SWORD 1.1 — A new model to detect and confirm whipsaw markets
A brand-new approach was developed, based on some of the same VIX variables, to early-detect and confirm the start of a damaging whipsaw market. We named it SWORD — the Sideways-market Whipsaw Oscillation Risk Detector.
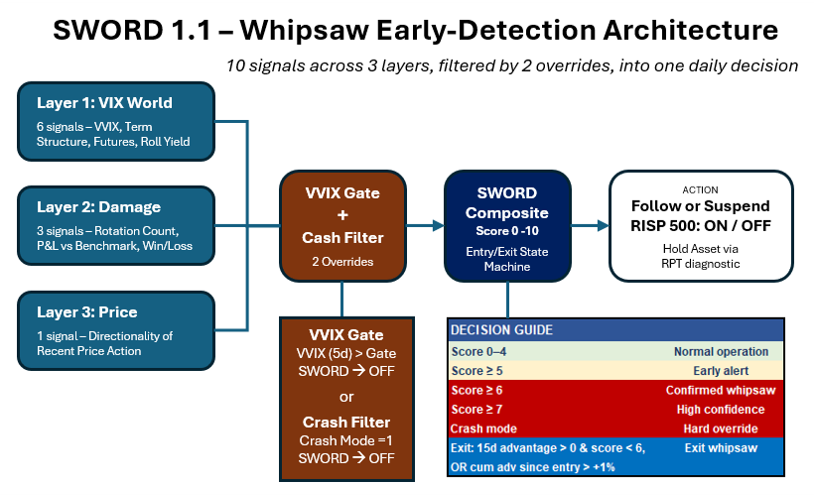
Unlike conventional whipsaw indicators, SWORD 1.1 doesn't rely on price action alone. By using the VIX ecosystem, we again dive deep into the risk behind the market. The VVIX variable (Volatility of VIX) proved the most determinant in the model. Other authors have discussed this before; our contribution is to add depth to it with more relevant variables. We also added an important distinction: we define a "whipsaw" only as one that damages the P&L. In other words, we only want to turn the RISP 500 off during whipsaws that cause losses — which happens when RPT levels are crossed repeatedly in rapid succession, rotating the allocation unnecessarily and producing losses. Whipsaws that don't damage the system are ignored by SWORD. That's how SWORD 1.1 is designed to work alongside the RISP 500.
RISP 500 + SWORD 1.1: the hero and its shield
We believe the pair RISP 500 + SWORD 1.1 will work in a powerful partnership.
2026 taught us the conditions under which RISP 500-guided strategies may fail to outperform the S&P 500. In the lab, we acted quickly. Instead of taking another decade, we designed the antidote to whipsaw markets in record time — a matter of a few months. How well it will work against future whipsaws remains to be seen. In financial markets, you can never claim victory too early. We never know what curveball the market will throw, and that's the reality we have to accept.
One final word about designing solutions, learned over my decades-long journey in the lab: no indicator or system is perfect, and none ever will be. You can never declare victory and game over. The RISP 500 and SWORD 1.1 will be continuously improved — a permanent work in progress. Just like the tools we used and the theories we trusted for decades — Modern Portfolio Theory, CAPM, the Markowitz Efficient Frontier, VaR, stress testing, technical analysis — nothing is perfect, and nothing ever will be. The most important lesson for us practitioners is to keep our minds open to new ideas and innovation.
Caravels crossed uncharted oceans; steam-powered ships conquered the ones after them. Each era gave way to the next. New challenges force us back to the drawing board. New ideas push us forward. It's called progress.
The next step in what you already do
We aren't looking to change the world, or the way practitioners do their work. We want to give practitioners a real edge in what they do. We want practitioners like you to be more successful — to beat the S&P 500 more consistently, outperform the competition, grow more AUM, and make clients happy and confident in their advisor. We want you to be the hero your clients expect you to be.
For the advisor and wealth manager, the routine stays almost the same — as do your existing strategies, judgment, and portfolios. The RISP 500™ is just another source of information, but one that can be a game changer in results. It will alert you to danger early to protect wealth, and help you gauge the best re-entry point after a crash, given your own risk tolerance.
This alone should give you a significant edge over your competition.
With a three-risk-level setup, you will become your client's hero.
If our story inspired you, or changed the way you see the challenges ahead, we'd love to hear from you and invite you to join us — to write the next chapter of this story together. I hope you're as excited as we are to take the next step.
Thank you.